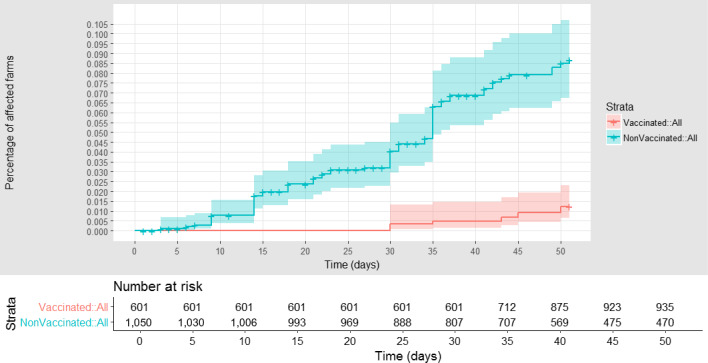
Figure 17.

Cumulative proportion of LSD vaccinated (red) and unvaccinated (blue) affected farms in Greece (Serres), according to follow‐up time starting with the occurrence of the index case in the first village affected. Shown under the graph are the numbers of farms at risk of infection in each of the two groups (vaccinated and non‐vaccinated) at different time after the first infection reported in each village
