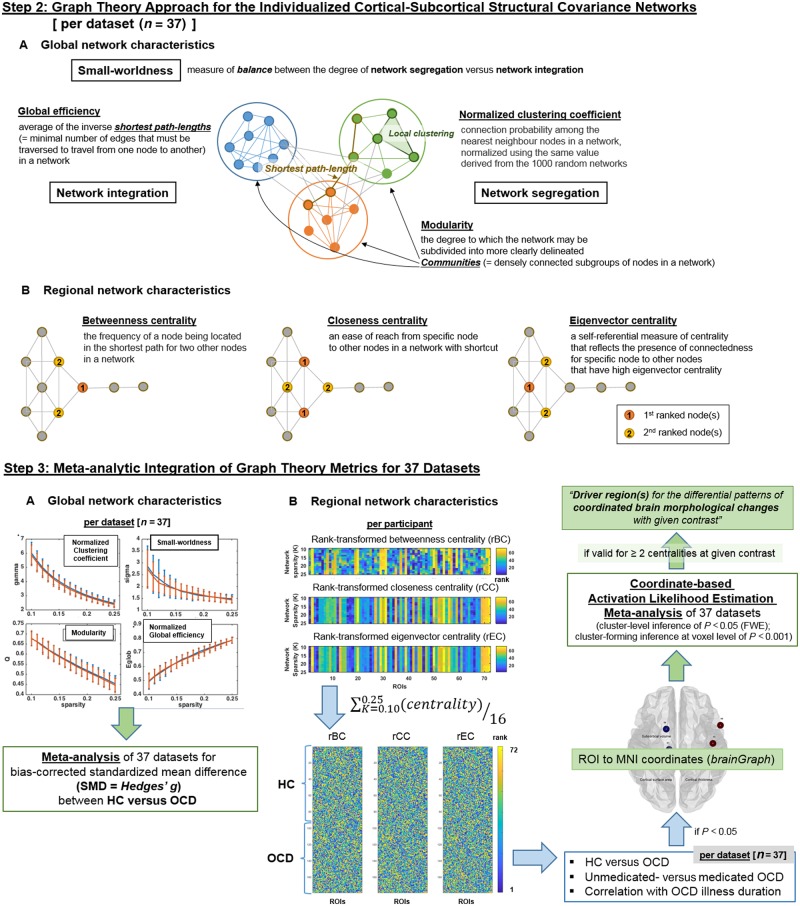
Figure 2.
Schematic description of the study procedures. (A) Calculation of graph theory metrics from the intra-individual brain structural covariance networks at single-subject level and (B) meta-analytic integration of graph theory metrics for 37 datasets. HC = healthy controls; ROI = region of interest.

