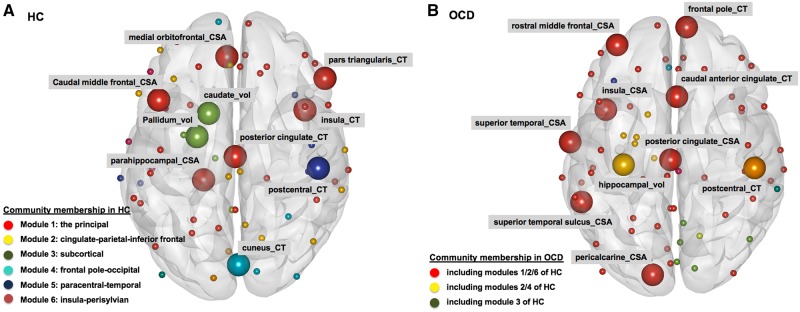
Figure 4.
Meta-analysis of community membership and hubs. (A) Healthy bontrols (HC); and (B) OCD. Spheres represent nodes [= bilaterally-averaged values of 33 cortical surface areas (CSAs), 33 cortical thickness (CT), and six subcortical volumes (vol)] comprising the intra-individual structural covariance network. Larger spheres represent hubs, and differential colours were used to denote the spheres (or network nodes) segregated as different modules.

