Figure 1.

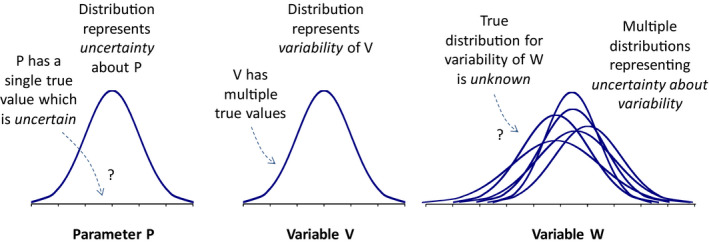
Illustration of the distinction between uncertainty and variability (left and central graphs), and that both can affect the same quantity (right hand graph)

Illustration of the distinction between uncertainty and variability (left and central graphs), and that both can affect the same quantity (right hand graph)