
Figure B.9.
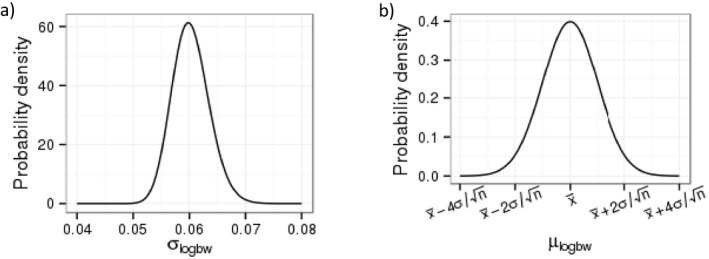
Posterior distributions of parameters of log‐normal distribution for body weight of 1‐year‐old children. The left panel shows the probability density for σlogbw, the standard deviation of log bw. The panel on the right shows the conditional probability density for μlogbw, the mean of log bw, given a value for the standard deviation σlogbw