
Figure B.10.
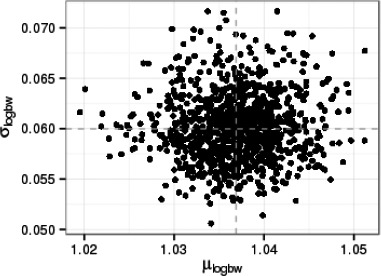
Monte Carlo sample of 1,000 values representing posterior uncertainty about σlogbw and μlogbw, given the data
Official websites use .gov
A
.gov website belongs to an official
government organization in the United States.
Secure .gov websites use HTTPS
A lock (
) or https:// means you've safely
connected to the .gov website. Share sensitive
information only on official, secure websites.
Monte Carlo sample of 1,000 values representing posterior uncertainty about σlogbw and μlogbw, given the data