
Figure B.11.
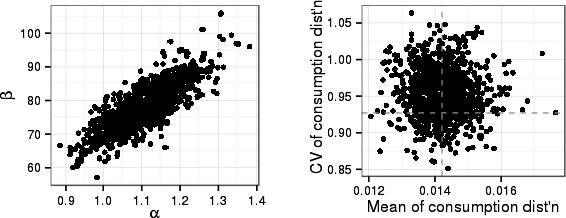
Monte Carlo sample representing posterior uncertainty about parameters for the gamma distribution describing variability of consumption. The left panel shows uncertainty about the shape and rate parameters. The panel on the right shows uncertainty about the mean (kg/day) and coefficient of variation of the consumption distribution