
Figure B.17.
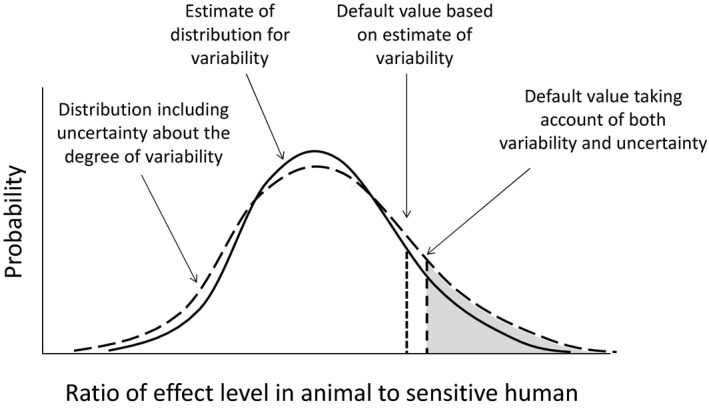
Graphical representation of how uncertainty about the distribution for variability between chemicals can be taken into account when setting a default assessment factor
Official websites use .gov
A
.gov website belongs to an official
government organization in the United States.
Secure .gov websites use HTTPS
A lock (
) or https:// means you've safely
connected to the .gov website. Share sensitive
information only on official, secure websites.
Graphical representation of how uncertainty about the distribution for variability between chemicals can be taken into account when setting a default assessment factor