
Figure B.19.
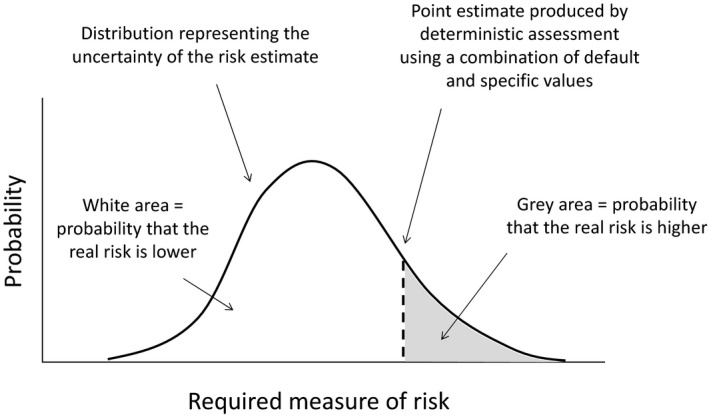
Graphical illustration of assessing the combined conservatism of the output of a deterministic assessment, relative to a specified measure of risk. The distribution is not quantified by the deterministic assessment, so conservatism of the point estimate has to be assessed either by expert judgement, by probabilistic modelling, or by comparison with measured data on risk