
Figure B.26.
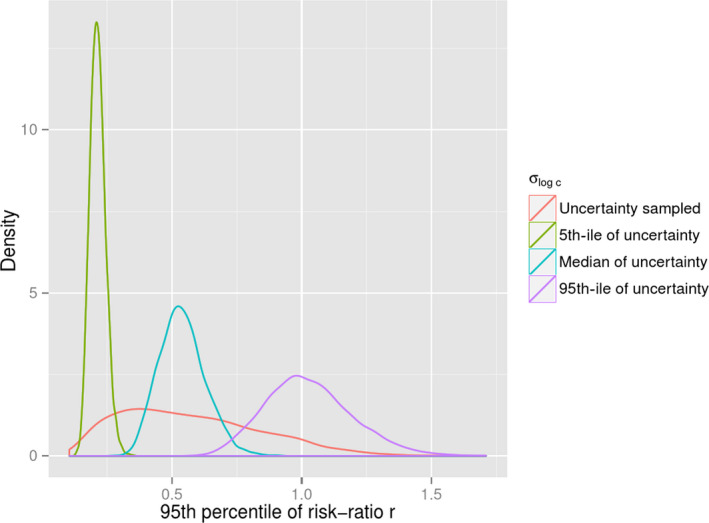
Uncertainty about the 95th percentile of the risk‐ratio r in four scenarios for the parameter σlogc which is the standard deviation of log concentration. Three scenarios show the consequences of fixing the parameter at different percentiles of uncertainty and the fourth shows the consequence of using the full distribution of uncertainty for the parameter