
Figure 5.
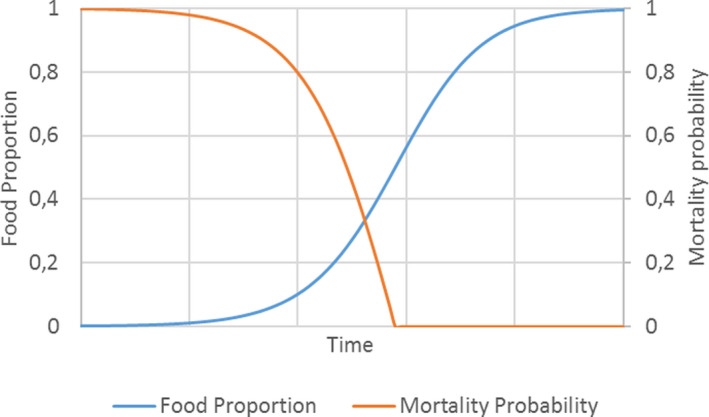
The logistic curve applied to available food for larvae and the related probability of individual larval mortality shown as proportional change in parameter values assuming the food levels grow with time from a very low level at time zero
Official websites use .gov
A
.gov website belongs to an official
government organization in the United States.
Secure .gov websites use HTTPS
A lock (
) or https:// means you've safely
connected to the .gov website. Share sensitive
information only on official, secure websites.
The logistic curve applied to available food for larvae and the related probability of individual larval mortality shown as proportional change in parameter values assuming the food levels grow with time from a very low level at time zero