
Figure 12.
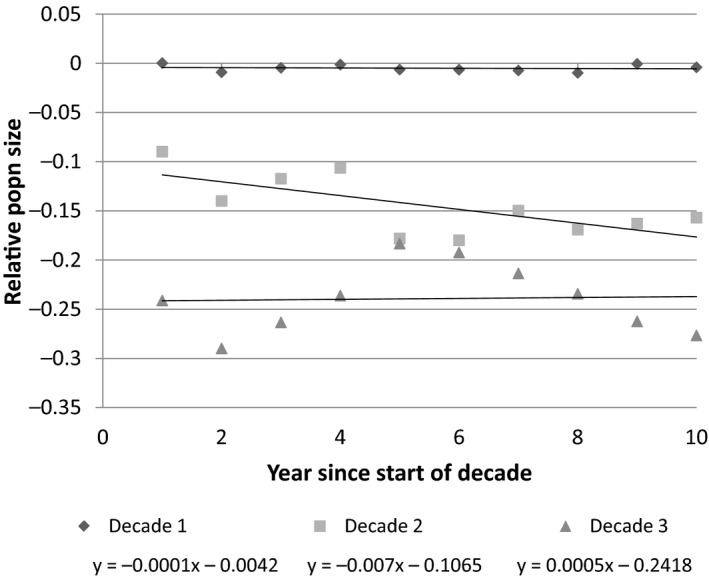
Three 10‐year time series created by splitting the result of the 30‐year run with 20 years application from Figure 11 into three decades then fitting a linear regression of relative population size against year within each decade. The equations shown for each decade indicate the slope of the relative PGR for that decade