
Figure 15.
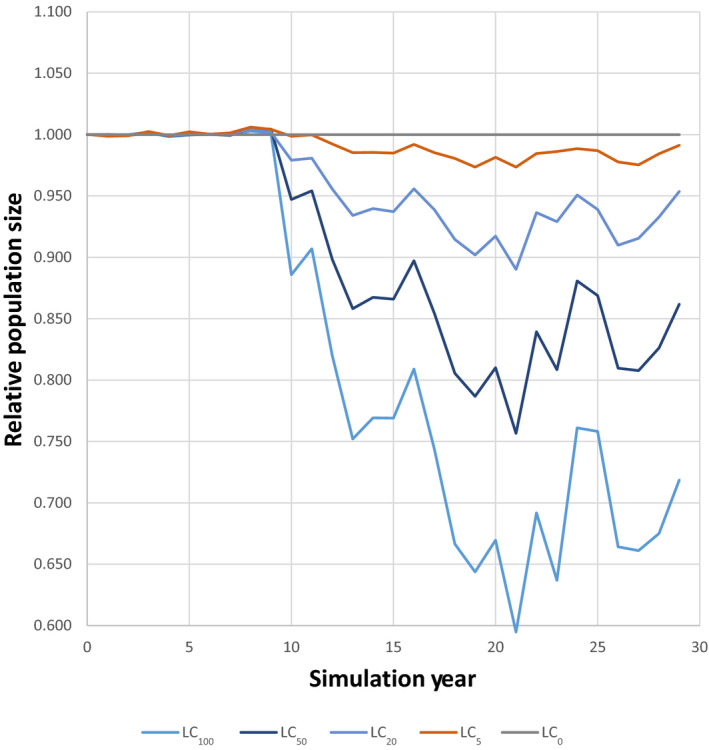
Time series for four relative population sizes resulting from LC x/LC0 with pesticide application starting in year 10
Official websites use .gov
A
.gov website belongs to an official
government organization in the United States.
Secure .gov websites use HTTPS
A lock (
) or https:// means you've safely
connected to the .gov website. Share sensitive
information only on official, secure websites.
Time series for four relative population sizes resulting from LC x/LC0 with pesticide application starting in year 10