
Figure 22.
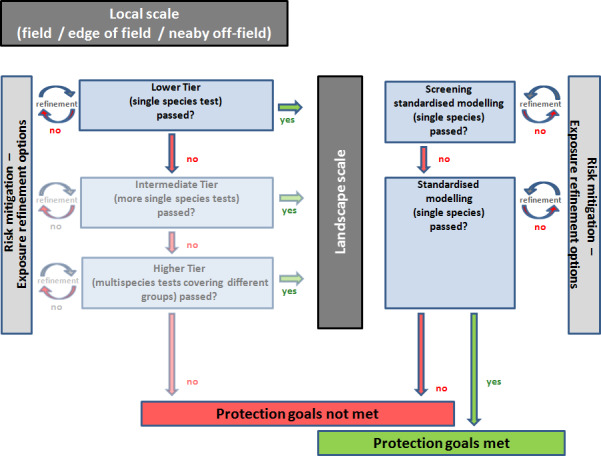
Illustrative risk‐assessment flow chart for amphibians and reptiles exposed to plant‐protection products or the active substances in PPP. In order to meet the specific protection goals for amphibians and reptiles, the criteria of both the acute and chronic effects assessment at a local scale and the long‐term population modelling at landscape‐scale components have to be passed