Figure 30.

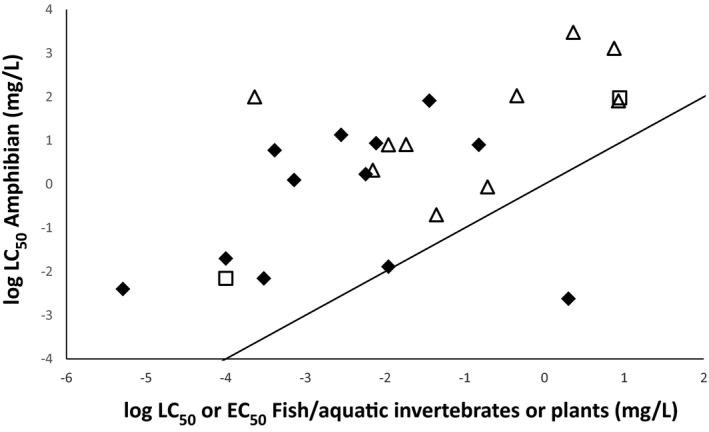
Comparison of the acute sensitivity (log LC 50) of amphibians with the lowest acute endpoint of fish (open square), aquatic invertebrates (filled diamond) or aquatic plants (open triangle) for 24 active substances

Comparison of the acute sensitivity (log LC 50) of amphibians with the lowest acute endpoint of fish (open square), aquatic invertebrates (filled diamond) or aquatic plants (open triangle) for 24 active substances