
Figure 32.
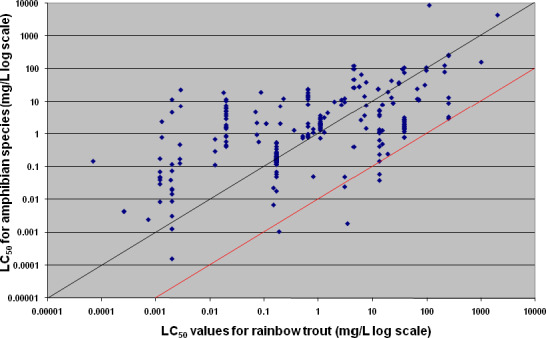
Comparison of each amphibian acute toxicity value with the respective acute toxicity value for rainbow trout (Oncorhynchus mykiss). The black line is the 1:1 line, i.e. the line indicating that the outcome for rainbow trout and amphibians would be exactly the same. The red line considers the assessment factor of 100 applied in the acute risk assessment for fish, i.e. where toxicity to an amphibian would be exactly 100 times higher than toxicity to the rainbow trout (EFSA PPR Panel, 2013)