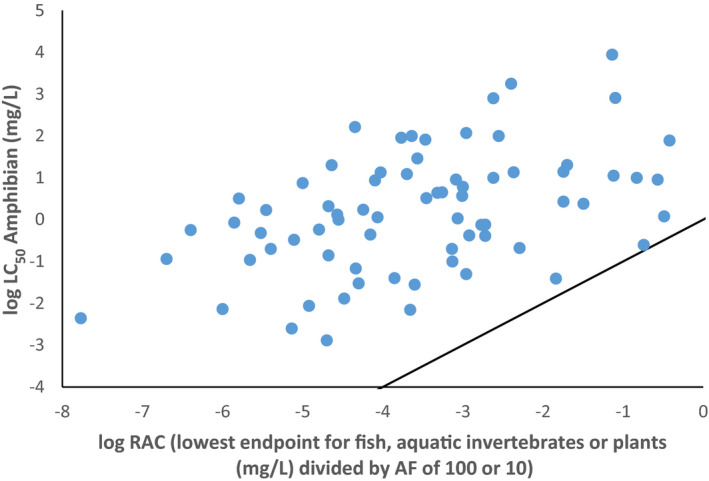
Figure 35.

Comparison of the lowest RAC (regulatory acceptable concentration, i.e. lowest endpoint for fish, aquatic invertebrates or plants divided by the current assessment factors of 100 resp. 10) with the respective amphibian acute endpoint. The black line is the 1:1 line, i.e. the line indicating that the outcome for the surrogate species (with assessment factor) and amphibians (without assessment factor) would be exactly the same
