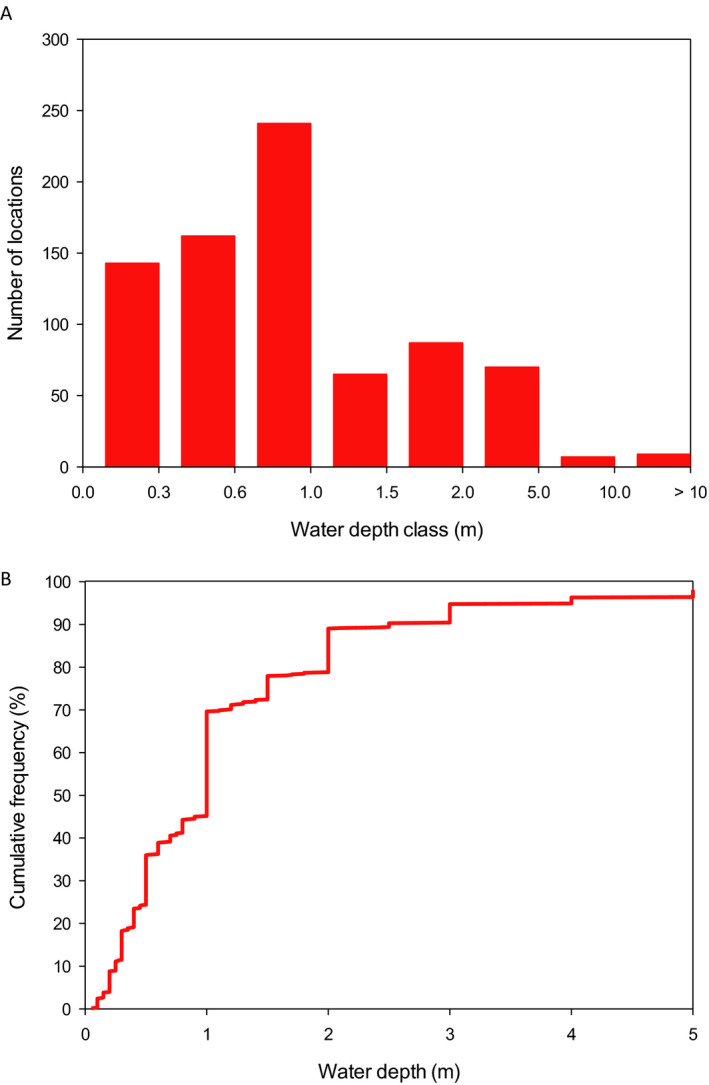
Figure 43.

Frequency (A) and cumulative frequency (B) distribution of water depth of 784 water bodies in Spain. Note that in graph 1A the x‐axis is not linear and that all class boundaries are indicated. In graph 1B, water bodies with a depth greater than 5 m have not been included.
