
Figure 52.
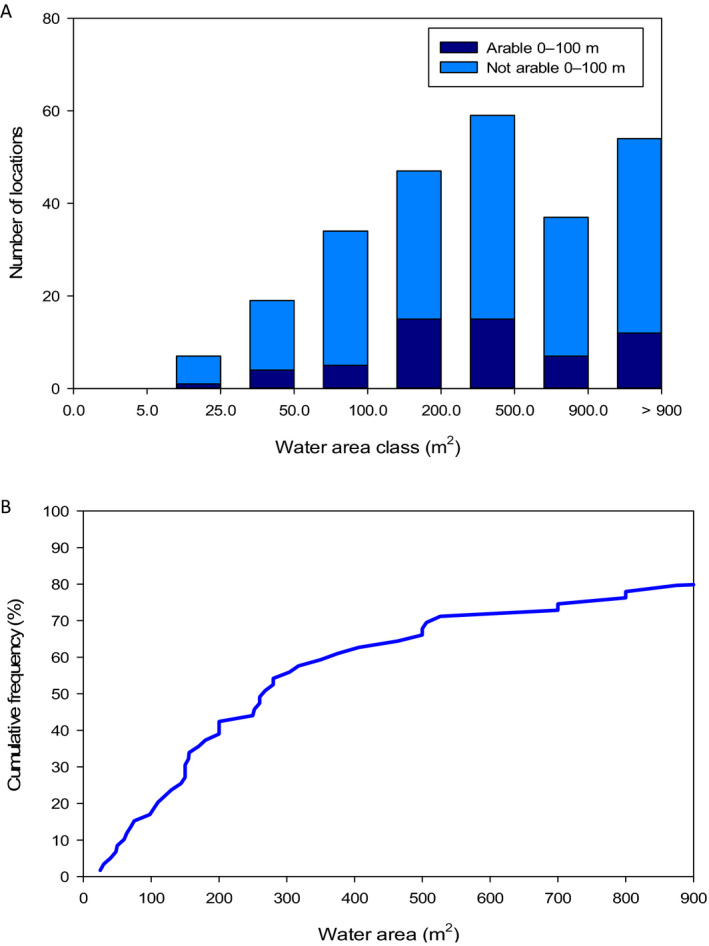
Frequency distribution (A) of water surface area of the 59 ponds in the UK where a percentage of arable land use was observed in the 0–100 m distance zone from the perimeter of the pond, plus the remaining 198 sampled ponds. Cumulative frequency distribution (B) is for the 59 ponds