
Figure 4.
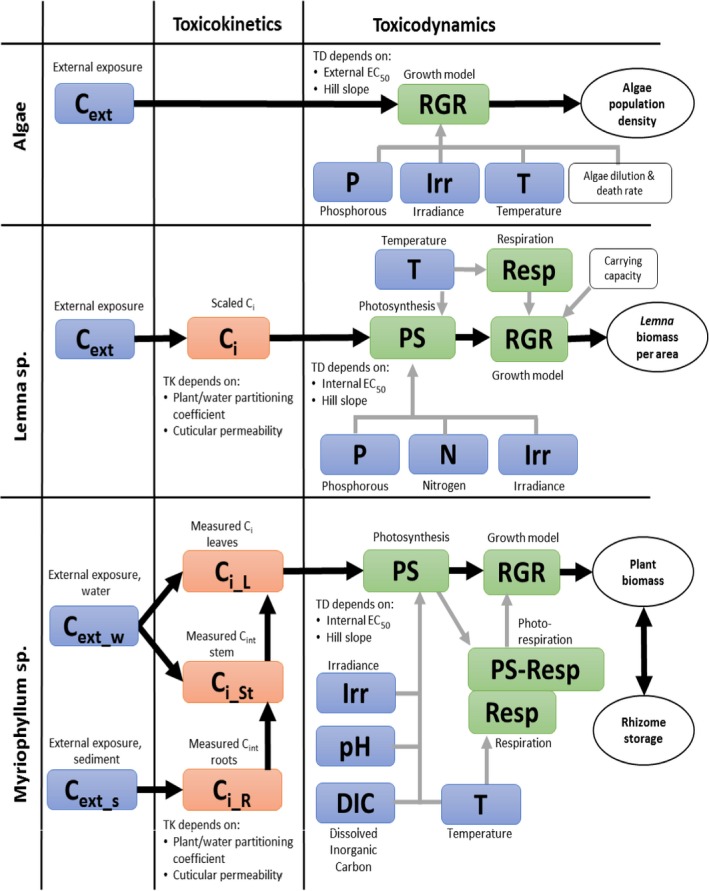
Schematic representation of the algae, Lemna spp. and Myriophyllum spp. models presented in Weber et al. (2012); Schmitt et al. (2013); Heine et al. (2014, 2015, 2016a). External factors affecting chemical uptake or growth are given in blue, internal chemical concentrations in orange and the different rate constants affecting biomass growth of the plants or algae in the respective models are given in green. White squares denote other factors included in the model such as the algae media dilution rate specific for the flow though system used in the algae test and the density‐dependent growth incorporated in the Lemna model. Model endpoints are given in white circles. The output of the growth model is relative growth rates (RGR) and the growth rates are affected by the internal concentrations via a concentration–response relationship defined by the concentration decreasing growth by 50% (EC 50) and a slope parameter of the curve (Hill slope). These two parameters are equivalent to the m and β describing the relationship between internal concentrations or damage and hazard in the IT version of GUTS (see Figure 2)