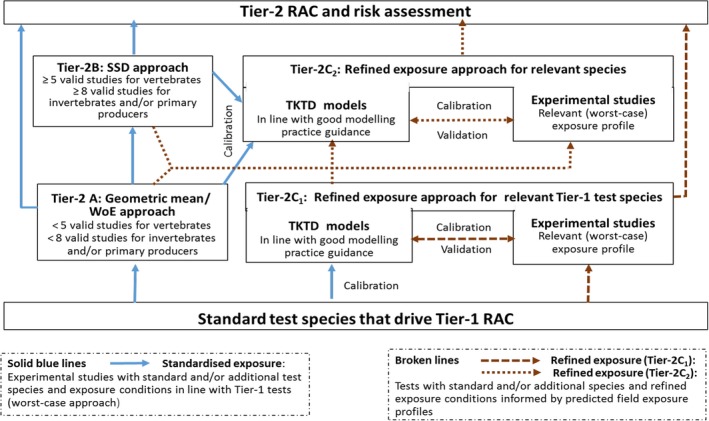
Figure 6.

Schematic presentation of the different Tier‐2 approaches in the aquatic effect/risk assessment for PPPs. The different types of arrows indicate different approaches (solid blue lines refer to tests with standardised exposures; broken lines refer to tests with refined exposures). Further details on the geometric mean and species sensitivity distribution (SSD) approaches can be found in Chapter 8 of the Aquatic Guidance Document, while information on experimental refined exposure tests are given in Chapter 9 of the Aquatic Guidance Document (EFSA PPR Panel, 2013). Suggestions how to apply a Weight‐of‐Evidence (WoE) approach in Tier‐2 effect assessment if toxicity data for a limited number of additional species are available can be found in Section 8.2.2 of the Scientific Opinion on sediment effect assessment (EFSA PPR Panel, 2015)
