
Figure 8.
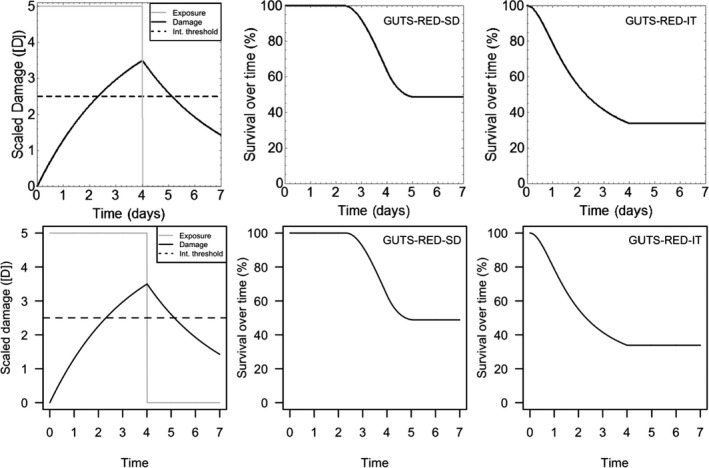
Test of the Mathematica (upper panel) and R (lower panel) implementation of GUTS‐RED‐SD and GUTS‐RED‐IT models under 4‐days constant exposure. The left panels show the scaled damage (black) and the external (gray) concentrations together with the internal threshold (dashed line). The middle panels show the survival over time for the GUTS‐RED‐SD model, parameters: hb = 0, kD = 0.3 (time−1), bw = 0.5 (L mol−1 time−1) and zw = 2.5 ([D]). The right panels show the survival over time for the GUTS‐RED ‐IT model with parameters: hb = 0, kD = 0.3 (time−1), mw = 2.5 ([D]) and β = 2 (−). Table 2 gives a full list of parameters with the explanation