
Figure 10.
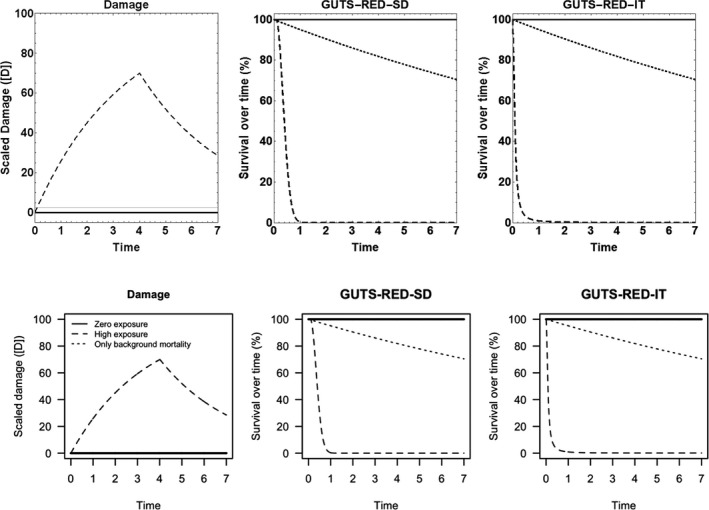
Mathematica (upper panel) and R (lower panel) implementation test under extreme cases: (i) zero exposure and no background mortality (solid lines), (ii) high exposure over days 1–4 (100 [D]) (dashed lines) and (iii) zero exposure with a slight background mortality (dotted lines). The left panels show the scaled damage; the middle panels show the survival over time under the GUTS‐RED‐SD model; the right panels show the survival over time under the GUTS‐RED‐IT model. Parameter values for the GUTS‐RED‐SD model: kD = 0.5 (time−1), bw = 0.3 (L mol−1 time−1) and zi = 2.5 ([D]); parameter values for the GUTS‐RED‐IT model: kD = 0.5 (time−1), mi = 2.5 ([D]) and β = 2 (−). Parameter hb was equal to 0 for extreme cases (i) and (ii); hb = 0.05 (time−1) for extreme case (iii). Table 2 gives with the list of parameters and their explanation