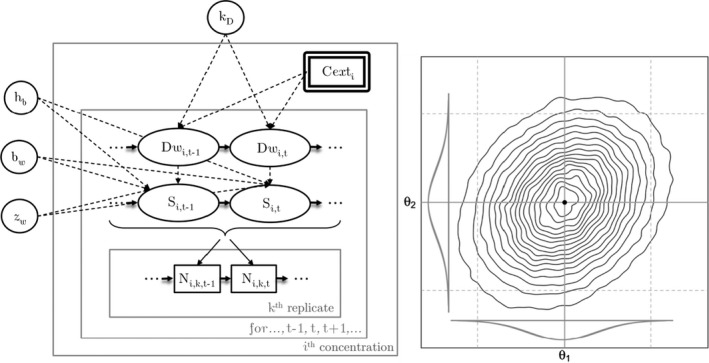
Figure 13.

Left panel shows Directed Acyclic Graph (DAG) for the model GUTS‐RED‐SD when the exposure concentration (covariate Cext in double rectangle) is constant over time. Observed survival numbers N are represented in rectangles; ellipses correspond to latent variables (Dw for the scaled damage and S for the survival rate) and circles to parameters to estimate. Deterministic links are represented by dashed arrows, whereas stochastic links are represented by solid arrows. Grey external rectangles stand for replicate (index k), time course (index t) and exposure concentration (index i). Right panel shows theoretical binormal joint posterior distribution of parameter vector (θ1, θ2). Ellipses correspond to isoclines of the joint posterior distribution; grey distributions are marginal posterior distributions of both parameters; solid horizontal and vertical lines correspond to the medians of these marginal distributions; dashed horizontal and vertical lines correspond to the 2.5% and 97.5% quantiles of the marginal distributions. See Table 2 with the list of parameters and their explanation
