
Figure 14.
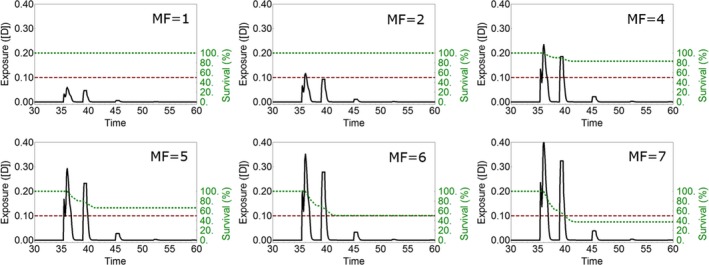
Example simulations of survival over time (dotted green lines) with the GUTS‐RED‐SD model where parameters are: kD = 0.5 ([time]−1), bw =0.05 (L mol−1 time−1) and zw = 4 ([D]), for increasing multiplication factors (MF) to an exposure profile P (solid black lines). The dashed red line indicates the 50% survival threshold that is reached for a multiplication factor of 6. Hence, in this case, LP 50 = 6. Note that the LPX is not necessarily always a whole number. Table 2 gives the list of parameters and their explanation