
Figure 16.
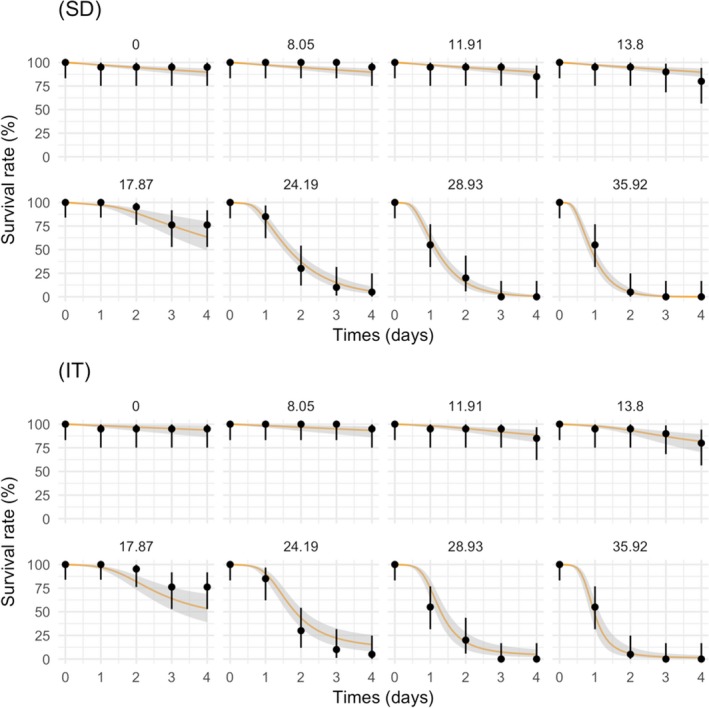
Survival over time (SOT) view of model calibration based on data from a typical acute toxicity study, with observations of survival under constant exposure over 4 days: (upper panel) model GUTS‐RED‐SD; (lower panel) model GUTS‐RED‐IT. The survival over time is represented as a function of time for each tested concentration (headers of single plots): black dots are the observations (observed numbers of survivors divided by the initial number of individuals), black segments show the between‐replicate variability, while the orange solid line corresponds to the median curve. The grey band is the 95% credibility band representing the uncertainty. Survival is shown as rate, meaning that stochastic influence on the number of survivors over time is not considered. Respective results including this stochasticity are shown in Appendix B.1