
Figure 17.
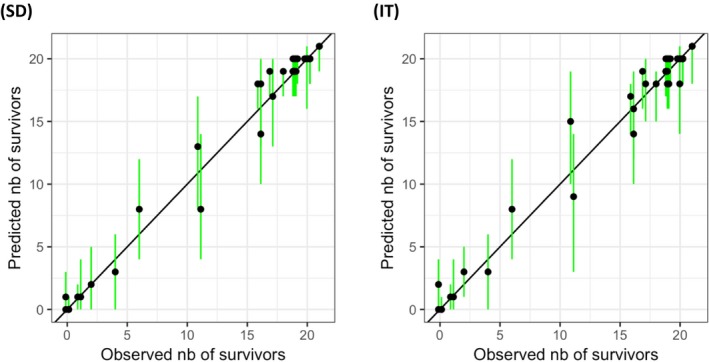
Posterior Predictive Check for the GUTS‐RED‐SD (left panel) and the GUTS‐RED‐IT (right panel) models, calibrated on a typical acute toxicity test. The x‐coordinate of black dots is the observed number of survivors while the y‐coordinate is the predicted median number of survivors. Vertical segments stand for the 95% credible intervals of the predicted values. These intervals are represented as green segments if they overlap with the line y = x