
Figure 18.
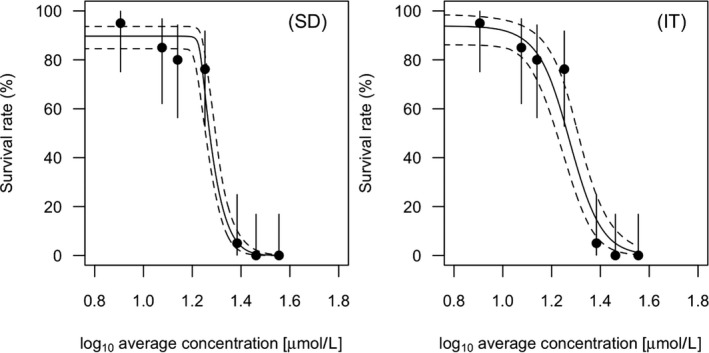
Concentration–response view of the GUTS‐RED‐SD (left panel) and GUTS‐RED‐IT (right panel) model calibration results obtained from data of a typical acute toxicity study with observations of survival under constant exposure over 4 days. Shown are the observed (black dots) and the modelled survival rates at the end of the 4‐day observation period. Please note that the model parameters have been calibrated on the survival probabilities over time, and not on the concentration–response data. The solid line corresponds to the median curve, while the dashed lines delimit the 95% credibility band representing the uncertainty. An analogue plot resulting from GUTS modelling under a frequentist framework is given in Figure B.5 of Appendix B