
Figure 19.
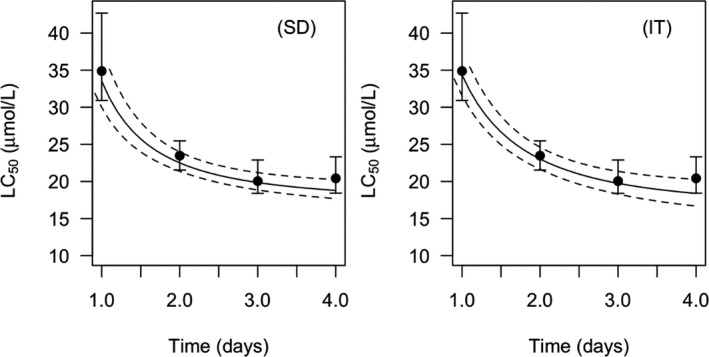
LC 50 estimates from the calibrated GUTS models (GUTS‐RED‐SD on the left panel, GUTS‐RED‐IT on the right panel) as represented by the solid lines (median curve) and the dashed lines (95% credibility band for the uncertainty), or from a classical target time analysis as represented by black dots (median estimate) and segments (95% credible intervals)