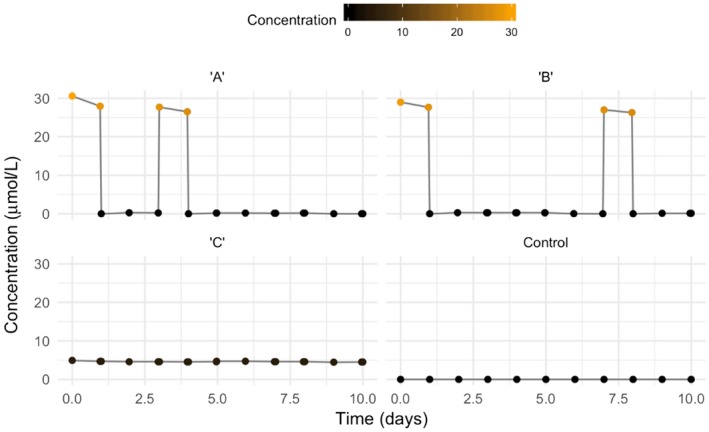
Figure 20.

Exposure profiles of the validation data set (Nyman et al., 2012, supporting material). ‘A’: two 1‐day pulses at concentration (~ LC 30 = 28 μmol/L) and 2‐days of recovery between pulses; ‘B’: two 1‐day pulses at concentration (~ LC 30 = 28 μmol/L) and 6‐days of recovery between pulses; ‘C’: constant exposure equal to the time‐weighted average (TWA) concentration from the pulsed exposure profiles (~ 4.6 μmol/L)
