
Figure 22.
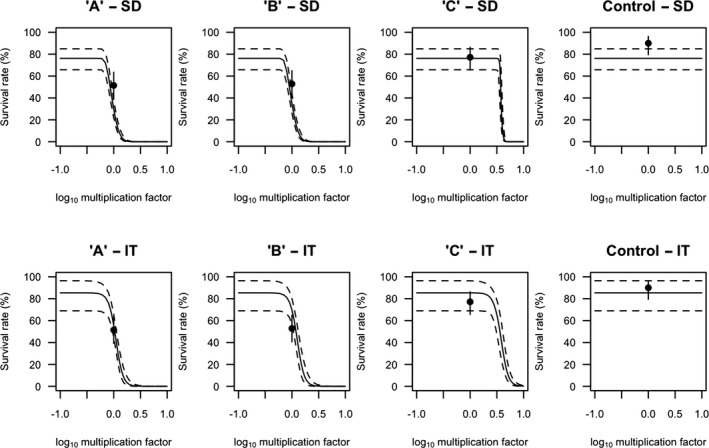
Multiplication factor‐response view of the GUTS‐RED‐SD (upper panel) and GUTS‐RED‐IT (lower panel) model validation results based on different pulsed or constant exposure profiles: ‘A’, ‘B’, ‘C’ and ‘Control’ (headers of single plots from left to right). Black dots depict the observed survival rate at day 10, while the solid line corresponds to the median predicted survival rate at day 10. The dashed lines delineate the 95% credibility band representing the uncertainty coming from the uncertainty on parameters estimated obtained from the calibration data set. Corresponding frequentist results are given in Figure B.6 of Appendix B