
Figure 23.
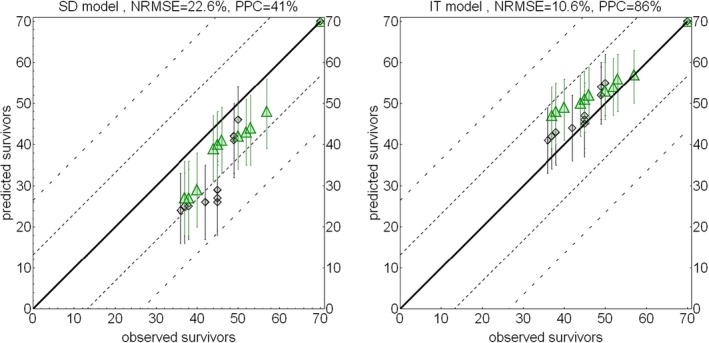
Posterior predictive plots of modelled versus observed numbers of survivors, left for the GUTS‐RED‐SD, right for the GUTS‐RED‐IT model. Triangles show results for pulse ‘A’, diamonds for pulse ‘B’. The error bars depict the 5th and 95th confidence limits for the predicted number of survivors. The solid line is the 1:1 line, the dotted line depicts the range of 25%, and the dashed line that of 50% deviation, (see Section 4.1.4.5). NRMSE and PPC values are given in the plot titles