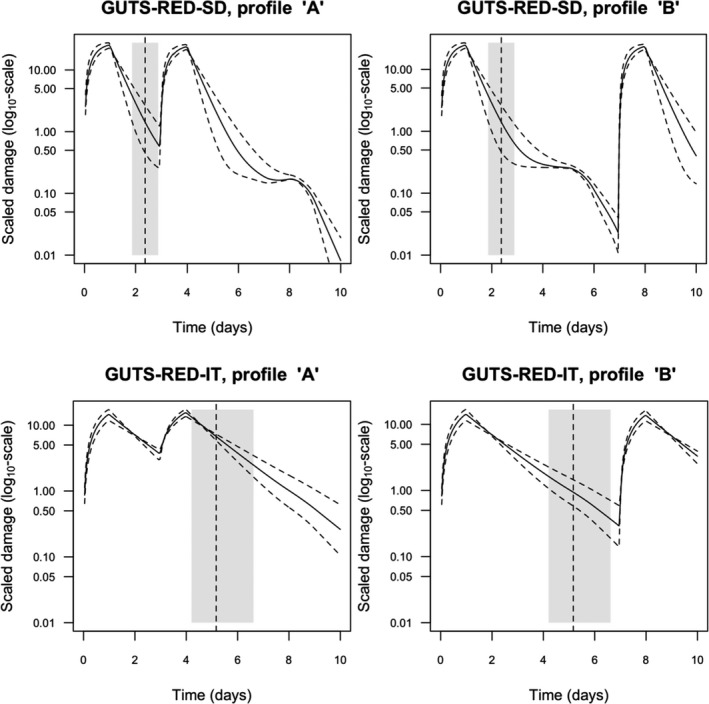
Figure 24.

Scaled damage over time for GUTS‐RED‐SD (top panel) and GUTS‐RED‐IT (bottom panel) models under time‐variable exposure profiles ‘A’ (left panels) or ‘B’ (right panels). The vertical dashed lines correspond to the median DRT 95 (see Section 4.1.4.5), calculated based on optimal parameter values for the dominant rate constant (kD) for the GUTS‐RED‐SD and the GUTS‐RED‐IT models and their lower and upper confidence limits (grey band). The median scaled damage is simulated (solid curve) together with its uncertainty (dashed curves) with the same equation in both GUTS models. Nevertheless, the median value of the dominant rate constant differs: kD = 2.154 μmol/L per day for model GUTS‐RED‐SD; kD = 0.732 mol/L per day for model GUTS‐RED‐IT
