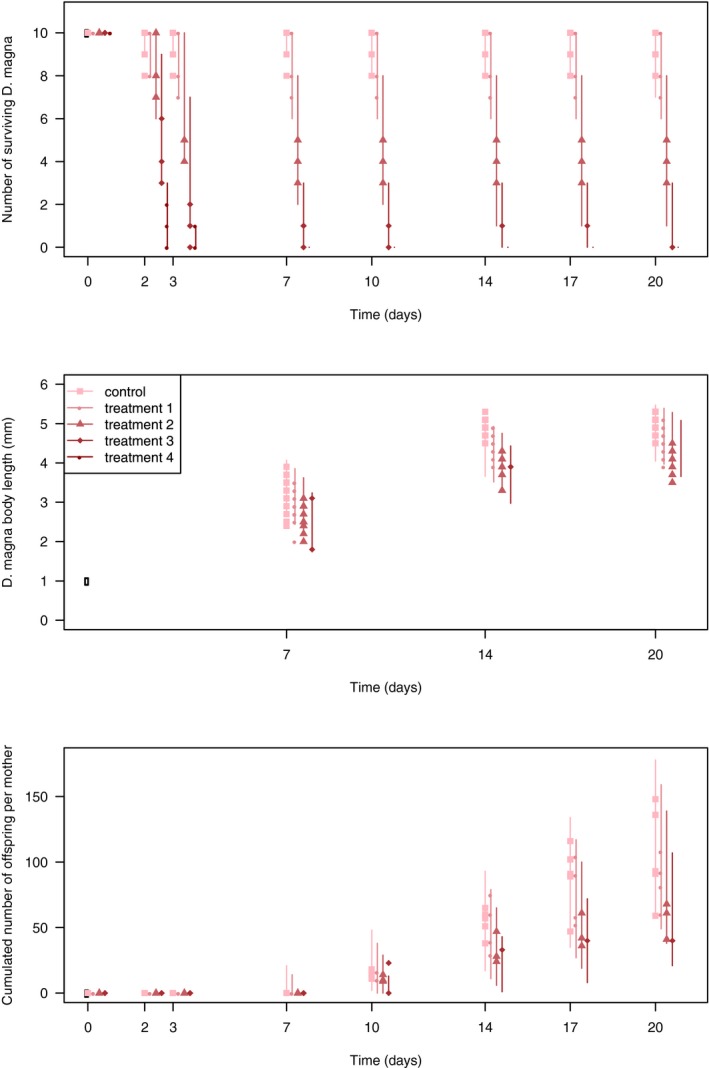
Figure 29.

Comparison of observations and predictions for survival (upper panel), growth (middle panel) and reproduction (lower panel) D. magna data. Observed data (symbols) and corresponding 95% credible intervals of simulated data (segments) are superimposed to graphically assess the goodness‐of‐fit (Adapted from Billoir et al. (2011))
