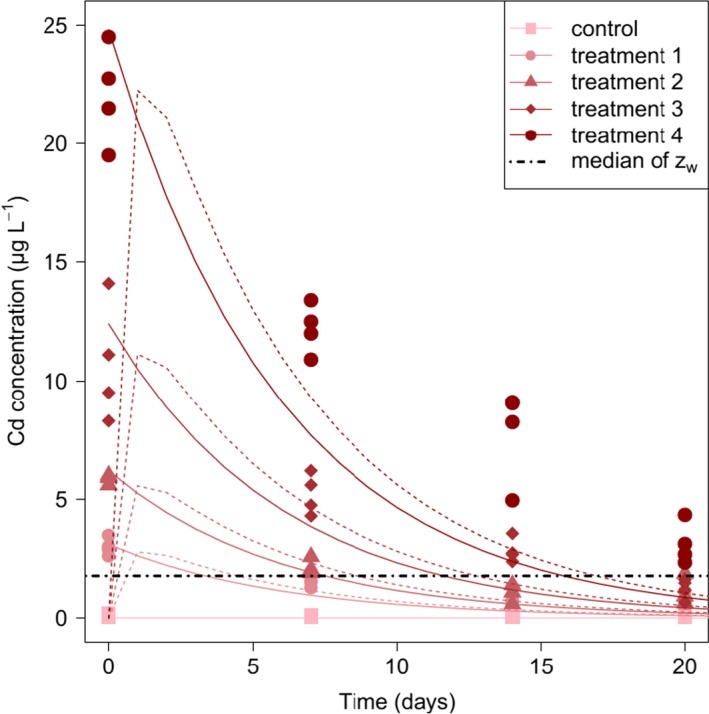
Figure 30.

Bioaccumulation kinetics: exposure data (symbols) are superimposed to fitted median curves of both the external concentration (solid lines) and the scaled damage (dashed lines). The dotted‐dashed line stands for parameter zw (the no‐effect‐concentration threshold for survival); adapted from Billoir et al. (2011)
