
Figure 33.
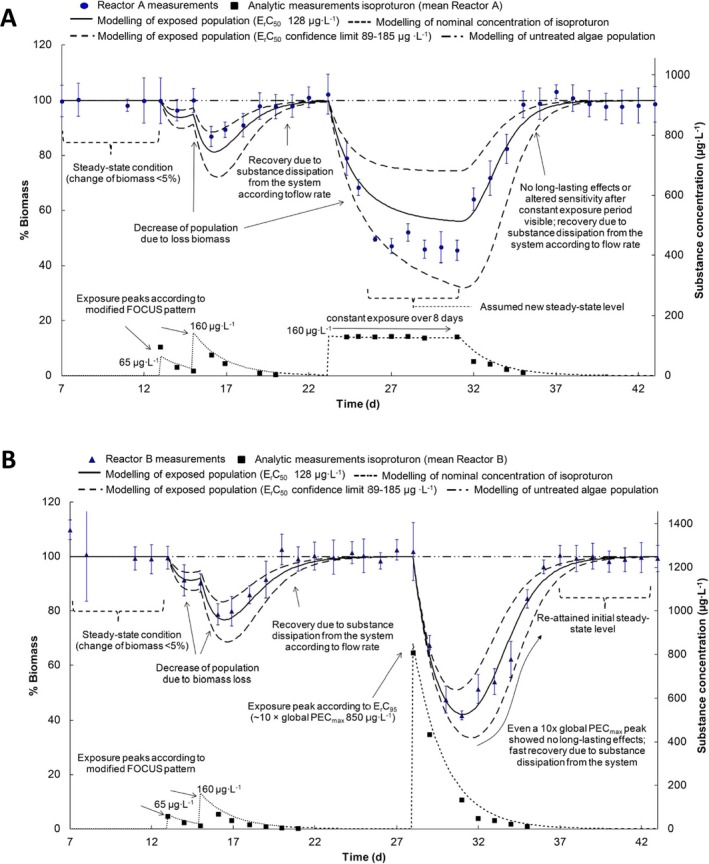
The results of the model validation for the algae Raphidocelis subcapitata (formerly known as Pseudokirscheriella subcapitata) showing the exposure concentrations of isoproturon in black squares (right y‐axis), and the corresponding algal biomass in black circles (replicate A, Panel A) and black triangles (replicate B, Panel B) (left y‐axis) together with the model prediction and its 95% confidence limits (Weber, 2009)