
Figure 35.
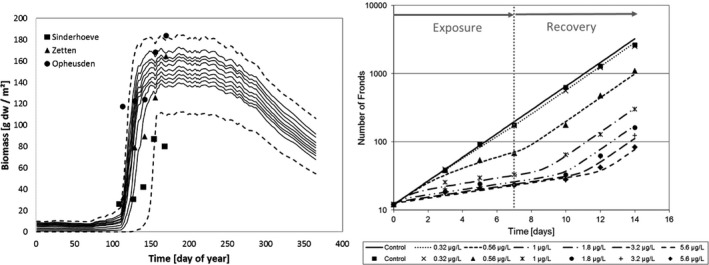
Left panel shows predicted Lemna growth (lines) over one year in comparison to observed field data from three Dutch ditches (symbols). The different lines show minimum and maximum (dashed) as well as the deciles of the biomass resulting from the Monte‐Carlo simulation with variation of model parameters. Right panel shows growth of L. gibba exposed to different concentrations of metsulfuron‐methyl. Exposure persisted until day seven with subsequent recovery in uncontaminated nutrient solution. Symbols show observed data and lines as calculated with the fitted model. Note that in the experiment the number of fronds was reduced to 15 at day seven, but the data were recalculated from day seven on by multiplication with the respective reduction factor (from Schmitt et al., 2013)