
Figure 36.
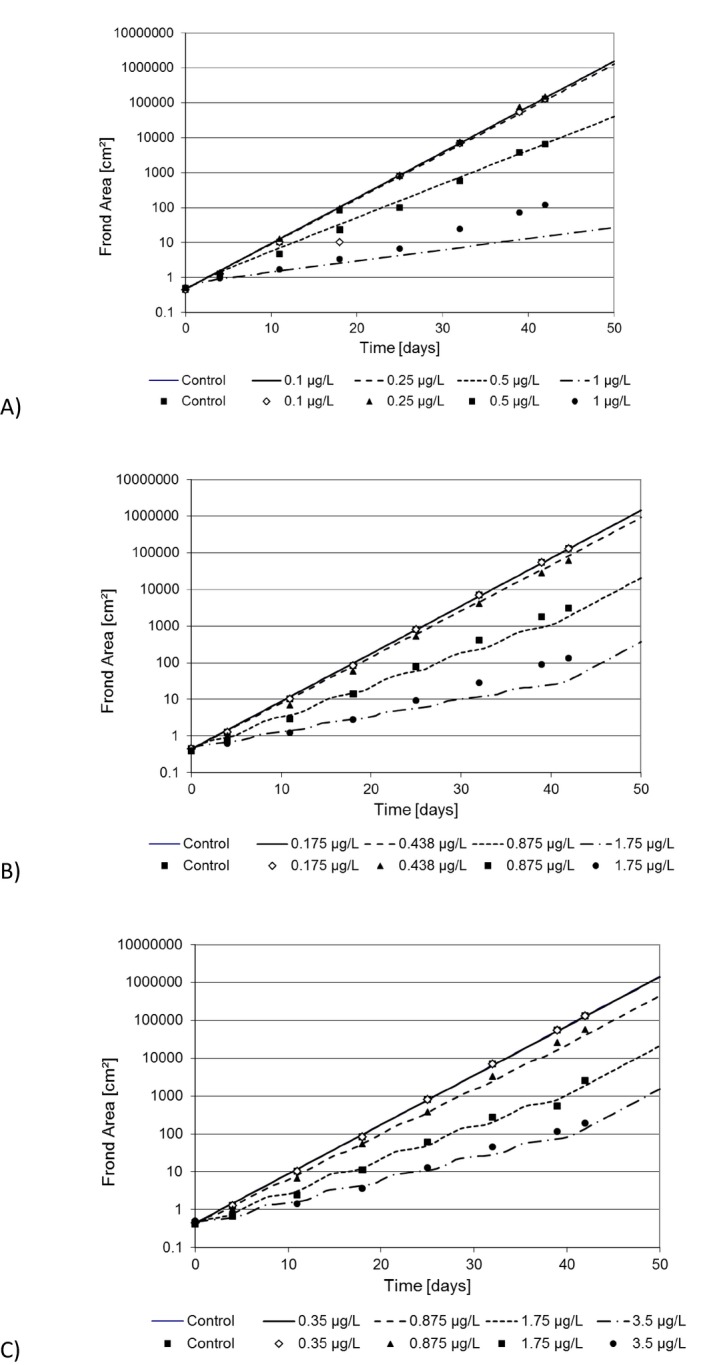
Predicted Lemna growth (lines) in comparison to observed data (symbols) from studies with three different exposure patterns: (A) continuous; (B) 4 of 7 days; and (C) 2 of 7 days exposure. Note: In all cases, control and lowest exposure level led to almost identical results in experiment and simulation and are therefore not distinguishable in the plots (from Schmitt et al., 2013)