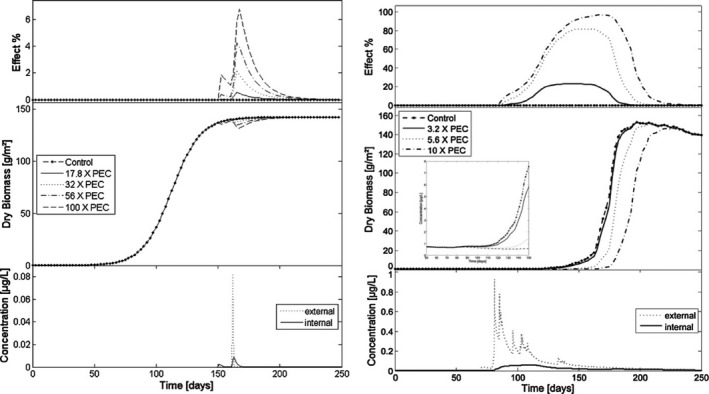
Figure 37.

Left panel shows predicted growth of Lemna (middle) for different levels of exposure to metsulfuron‐methyl caused by run‐off occurring when the population had reached carrying capacity. Lower panel: concentration time course. Upper panel: percentage effects calculated from the difference between control and affected biomass curves. For exposure levels below 17.8x, no deviation from the control was found and the respective results were not included in the plot. Right panel shows predicted growth of Lemna (middle) for different levels of exposure to metsulfuron‐methyl caused by drainage and considering the climatic conditions also underlying the exposure simulation. The inset shows a blow up of the period 50–150 days. Lower panel: concentration time course. Upper panel: percentage effects calculated from the difference between control and affected biomass curves. For exposure levels below 3.2x, no deviation from the control was found and the respective results were not included in the plot (from Schmitt et al., 2013)
