
Figure 39.
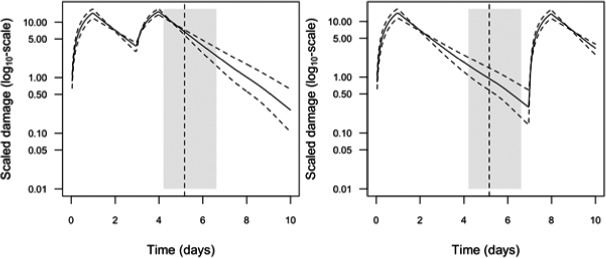
Example for exposure profiles that appear as toxicological dependent (left), or independent (right) regarding the simulated scaled damage (the solid line corresponds to the median curve, the dashed lines to the uncertainty limits). The dashed vertical line corresponds to the DTR 95, while the grey band corresponds to its 95% uncertainty range. In this example, kD = 0.732 day−1