Figure 41.

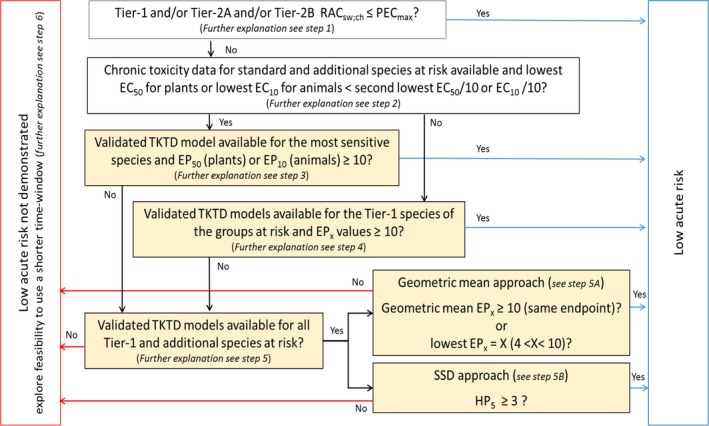
Decision scheme for the use of TKTD models and estimated EP 10/EP 50 and HP 5 values in chronic ERA. The boxes based on TKTD modelling are shaded. For further explanations, see the different steps (ad steps 1–6) described below

Decision scheme for the use of TKTD models and estimated EP 10/EP 50 and HP 5 values in chronic ERA. The boxes based on TKTD modelling are shaded. For further explanations, see the different steps (ad steps 1–6) described below