
Figure 43.
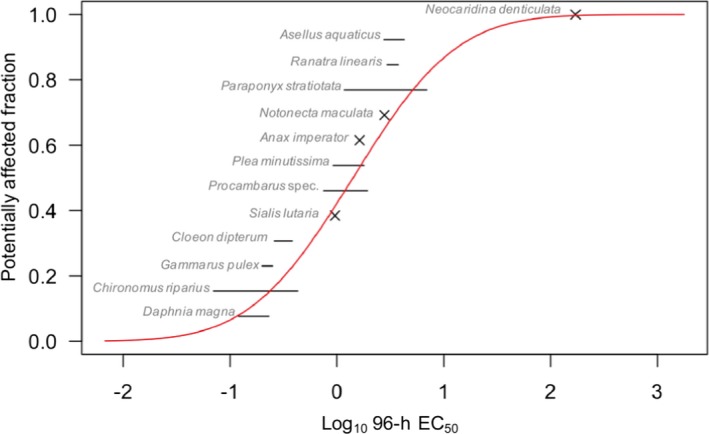
SSD graph constructed with 96‐h EC 50 values for 13 different arthropods presented in Table 9
Official websites use .gov
A
.gov website belongs to an official
government organization in the United States.
Secure .gov websites use HTTPS
A lock (
) or https:// means you've safely
connected to the .gov website. Share sensitive
information only on official, secure websites.
SSD graph constructed with 96‐h EC 50 values for 13 different arthropods presented in Table 9