
Figure 45.
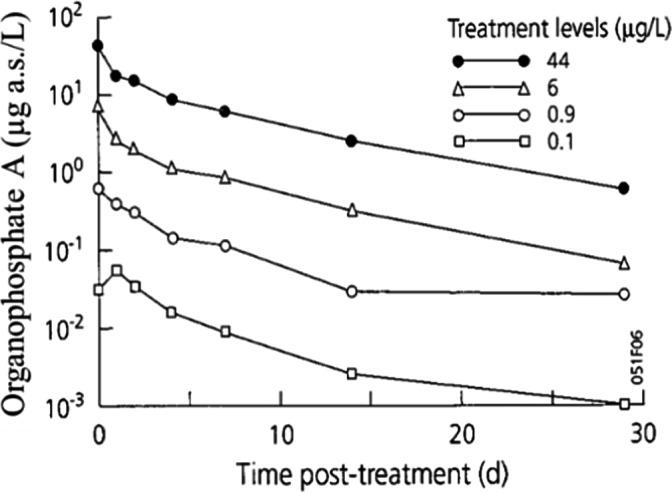
Dynamics of mean concentrations of Organophosphate A in depth‐integrated water samples in experimental ponds treated once with 0.1, 0.9, 6 and 44 μg a.s./L
Official websites use .gov
A
.gov website belongs to an official
government organization in the United States.
Secure .gov websites use HTTPS
A lock (
) or https:// means you've safely
connected to the .gov website. Share sensitive
information only on official, secure websites.
Dynamics of mean concentrations of Organophosphate A in depth‐integrated water samples in experimental ponds treated once with 0.1, 0.9, 6 and 44 μg a.s./L