
Figure B.2.
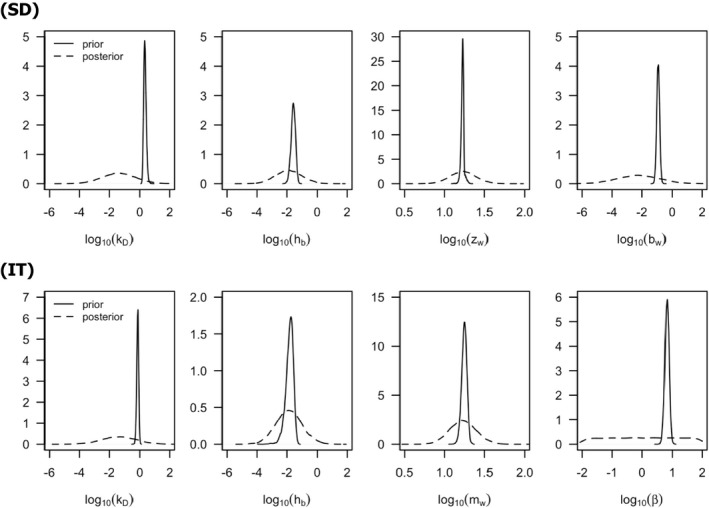
Comparison of priors and posteriors of the GUTS‐RED‐SD (upper panel) and GUTS‐RED‐IT (lower panel) model parameters (log10‐scale): the dotted distribution corresponds to the prior and the plain one to the posterior probability distribution of each parameter (x‐labels under single plots)