
. 2018 Aug 23;16(8):e05377. doi: 10.2903/j.efsa.2018.5377
© 2018 European Food Safety Authority. EFSA Journal published by John Wiley and Sons Ltd on behalf of European Food Safety Authority.
This is an open access article under the terms of the http://creativecommons.org/licenses/by-nd/4.0/ License, which permits use and distribution in any medium, provided the original work is properly cited and no modifications or adaptations are made.
Figure B.4.
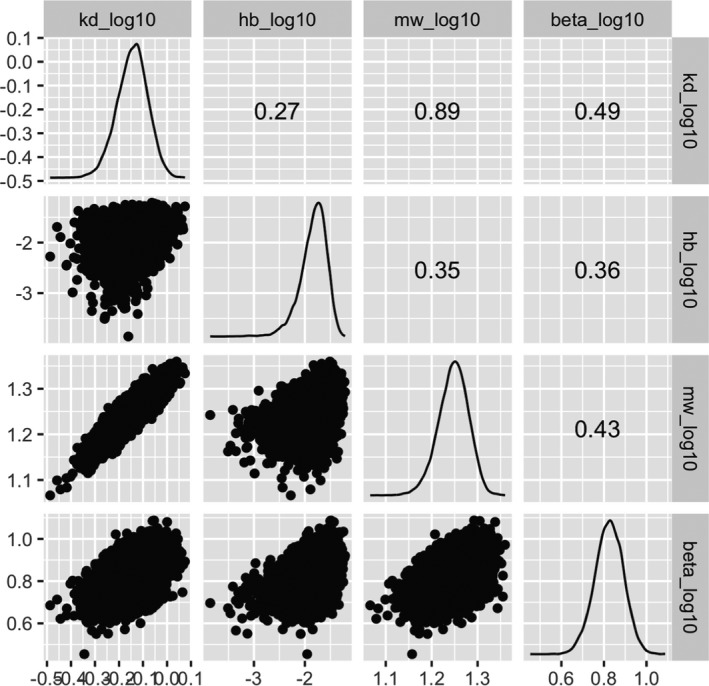
Correlation plot of the GUTS‐RED‐IT model parameters (log10‐scale)