
Figure B.5.
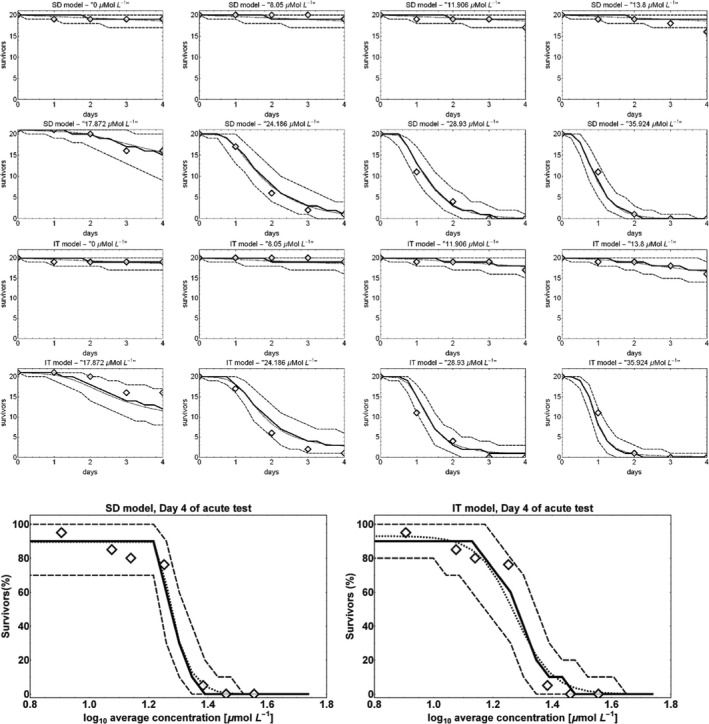
GUTS‐RED model calibration for the frequentist approach. Data from a typical acute toxicity study with propiconazole and G. pulex (see Section 4.2), with observation of survival under constant exposure over 4 days.
- (Top panels) Diamond symbols depict the survivors over time for the experimentally tested concentrations given in the plot titles. The solid lines show the modelled number of survivors, dashed lines are the 5th and 95th percentiles of model uncertainty.
- (Bottom panels) Observed (diamonds) and modelled survival at the end of the 4‐day observation period in the concentration–response view. The solid lines show the modelled survival at day 4, dashed lines are the 5th and 95th percentiles of model uncertainty. Dotted lines show the deterministic survival rate.