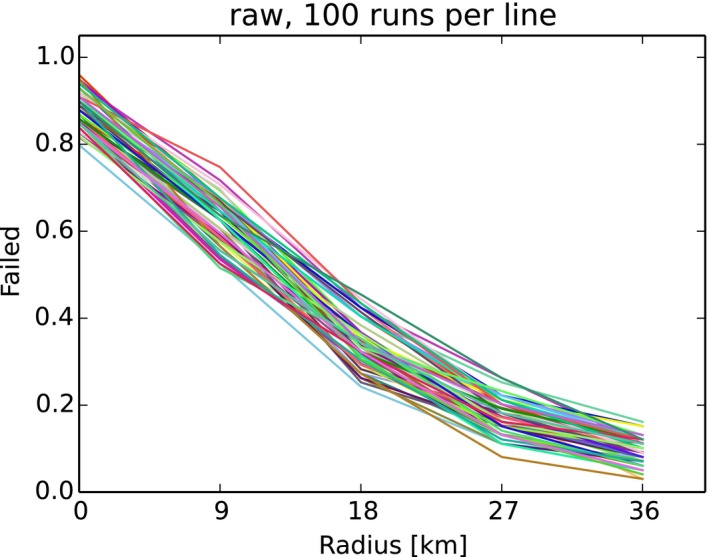
Figure 51.

Example and variability of the model output. The probability is shown that the implemented measures fail to prevent ASF spread out of the intensive hunting area as function to its width. Thirty lines show variability by representing the same output measure produced of the standard approach, i.e. 100 simulation runs (total 3,000 simulation runs). Every run applies identical parameters
