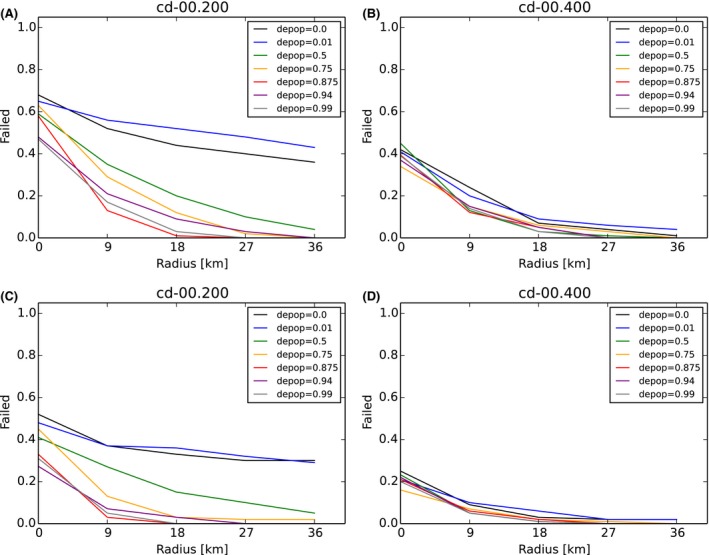
Figure 53.

Simulation output on the effect of alternative carcass removal rate (carcass removal = cd, see diagram title) and width of as well as efficiency in the intensive hunting zone (x‐axis)
The core zone is delineated using either random carcass detections within 4 weeks (top two diagrams) or perfect knowledge on carcass distribution prior to zoning (bottom two diagrams; remember only knowledge of carcass was perfect not removal, latter as in top row). Independent of the annual depopulation efficacy in (coloured lines) or width of the intensive hunting zone (x‐axis), logically, only carcass removal rate in the core + buffer zone can determine the failure rate out of the core + buffer zone (equally coloured line graphs at x‐axis zero value compared between left and right at CD = 20% and CD = 40% carcasses removed). As before, increased hunting effort in the intensive hunting zone further improves success chance (coloured lines per diagram). The hunting target was achieved every year with two campaigns. Each campaign was completed within 4 weeks. The protocol is repeated annually until the end of the simulations. In the core + buffer zones one campaign is performed after a half‐year waiting period, applying 90% culling of animals still there.
