
Figure 56.
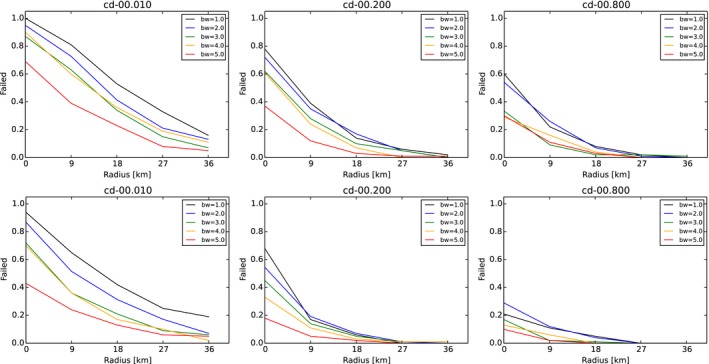
The effect of the width of the buffer zone on the final success assuming alternative carcass removal rates
The width of the buffer zone (bw) is represented by the coloured lines: black 1; blue 2; green 3; yellow 4; and red 5 times the wild boar group home range). The standard parameter used in scenarios above refers to buffer width (bw) = 3. Carcass detections and removal rate (cd; diagram title) is either 10% (left), 20% (middle); 80% right. Independently, the core zone is delineated based on random carcass detections during 4 weeks after ASF confirmation (top row) or perfect knowledge on carcass distribution (bottom row). The hunting efficiency in the intensive hunting zone is set to 75% distributed over two campaigns per year. Waiting time until culling of the core + buffer zone was 26 weeks and achieved by one campaign with 90% efficacy.