
Figure 59.
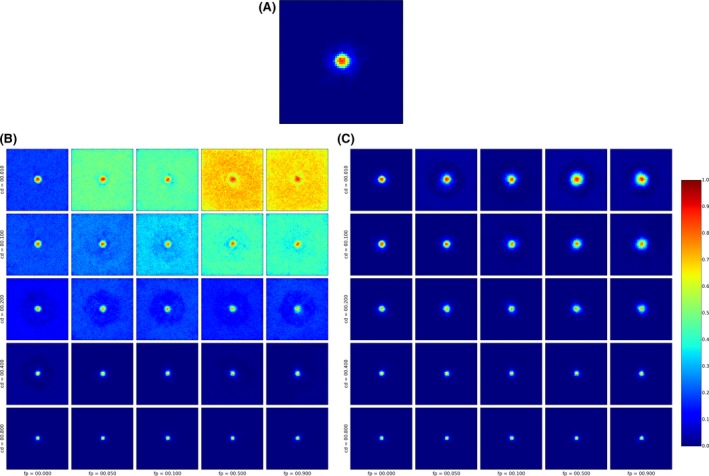
Spatial simulation output shown as a heat map of the proportion of 100 repetitions of alternative scenarios
Scenarios differed by applied control measures. (A) Enlargement of top‐left in (C) assuming the presence of a wild boar‐proof fence around the core zone, red area approximates the overlaid core zones of 100 runs, yellow, i.e. a much lower proportion, the buffer zones. The surrounding halos reveal the limited spread due to very high hunting efforts in the intensive hunting zone. (B) and (C) Scenario comparison for different levels of hunting i.e. 0% in (B) and 75% in (C). Both (B) and (C) cross‐tabulate column‐wise different permeability of the fence (left 0% wild boar proof; 5%; middle 10%; 50%; right 90% fence nearly absent) vs row‐wise different carcass detection rates (top 1%; 10%; middle 20%; 40%; bottom 80%). Zoning is based on perfect knowledge about infectious carcass distribution at the moment of zoning (results for 10% chance of carcass detection, see Lange et al., 2018).